
A better round. Right in front of you.
GPS, heatmaps, scoring, and on-course ordering.
One clear screen. One connected fleet.

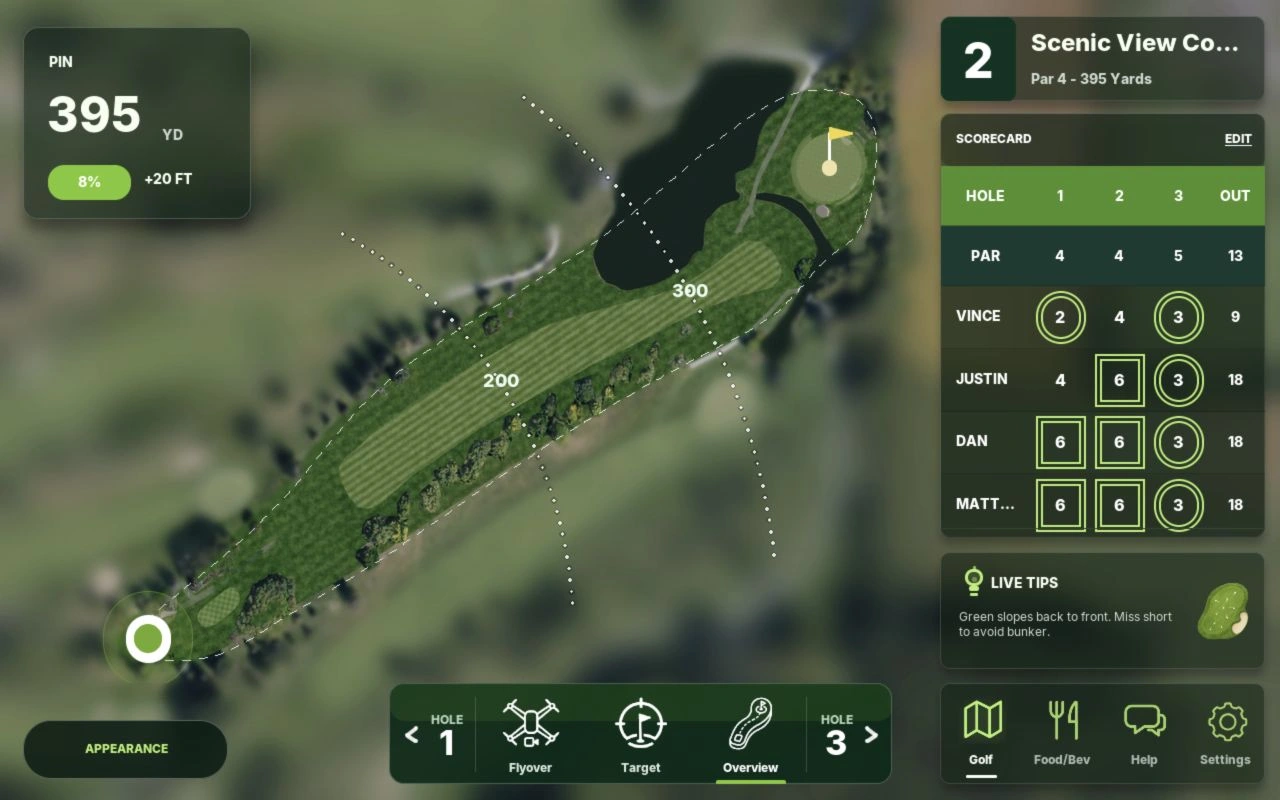
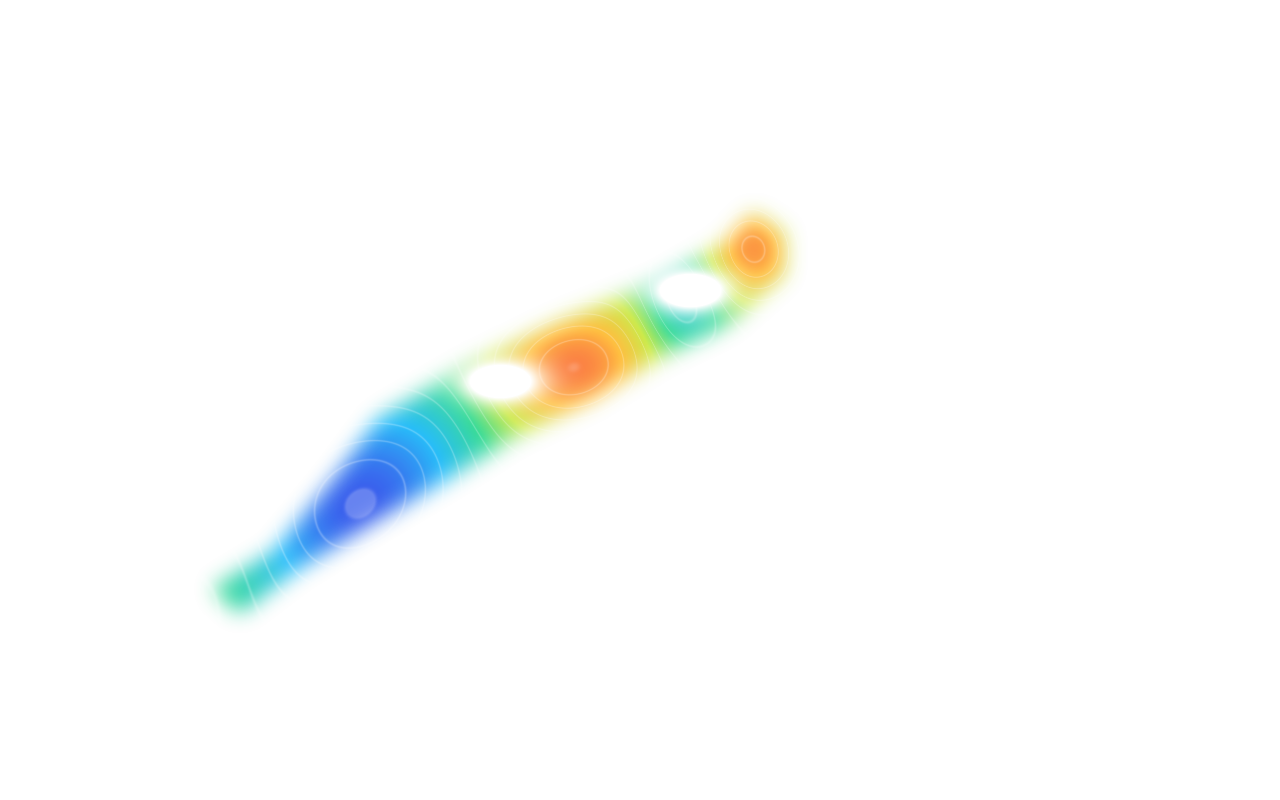

Preparing your cart demo
A better round is almost ready.
Preparing your cart demo.
Every part of the round. Connected.
One screen. Every part of the round.
Loading screen preview…
Pinpoint your yardage.
Read the terrain. Then pinpoint your yardage.
Try the test cart.
See the cart experience for yourself, starting with pay to unlock.
A demo experience. No real cart is unlocked.More value from every round.
Connect the player experience with the tools your team uses every day. Then compare a usage-based fleet plan using your own course numbers.
Usage-based pricing, with an upfront contribution that shapes your per-rider rate.
Model your own rider volume and compare total costs with your current screen proposal.
GPS, heatmaps, group scoring, and on-course ordering on the screen already in the cart.
Give players useful course information and a simple way to order through the round.
Cart access, location, boundaries, and service connected to the player-facing screen.
Help your team see where carts are and which parts of the fleet need attention.
See what your fleet could earn.
Model recovered cart fees, rider demand, and the cost of your rollout.
- Added revenue / year
- +$108,000
- Golf One cost / first year
- −$72,000
- Modeled repair savings / year
- +$1,800
Test the assumptions.
Your first-year calculation
- Recovered cart fees150 riders/month × $30 × 12
- +$54,000
- Screen-driven rider revenue150 riders/month × $30 × 12
- +$54,000
- Modeled usage cost3,000 riders/month × $2.00 × 12
- −$72,000
- Upfront contribution
- −$0
- Modeled repair savings
- +$1,800
Usage is modeled on the monthly riders entered. Rider lift and fee recovery are revenue assumptions; adjust monthly riders to reflect your expected billable volume. At 75 carts, modeled usage averages $80 per cart per month. Cart count alone does not change usage fees.
The illustrative rate moves from $2/rider at $0 upfront to $1.50 at $10,000 and $1 at $20,000. Repair savings default to two replacements at a $900 difference each. These are adjustable planning assumptions, not a quote or guaranteed savings; other operating costs and seasonality are excluded.
How could it look for another course?
Illustrative examples, not reported customer results. Select one to explore its model.
Plan the right cart-screen rollout.
What can players do on the cart screen?
The Golf One experience can bring together GPS course views, green heatmaps, group scoring, cart access, and food and beverage ordering. The exact rollout is planned with each course.
Does Golf One work for every fleet size?
Fleet needs vary by cart count, rounds, seasonality, course layout, and operating model. A demo is the best way to map the product and pricing assumptions to your course.
How does usage-based pricing work?
The current calculator models a per-rider Golf One rate that changes with the selected upfront contribution. Use your own operating inputs, then confirm final scope and commercial terms with Golf One.
Can we compare Golf One with an existing provider?
Yes. Bring your current quote or invoice and compare the same fleet, term, hardware, replacements, service, and usage assumptions. The on-page calculator is a starting model and should not replace an actual proposal.